A surprising fact: only 35% of adults can read the 20/20 line on a Snellen eye chart without vision correction. Dr. Herman Snellen created this iconic eye test chart in 1862, and it remains the primary standard to measure our vision quality.
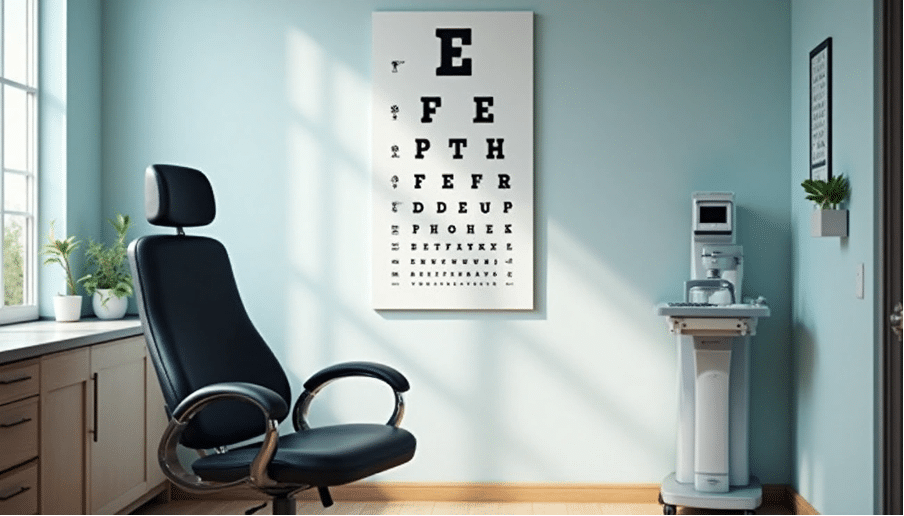
The chart’s design features 11 lines of block letters. Large letters sit at the top, and each line below shows progressively smaller ones. Eye doctors position their patients exactly 20 feet from this visual acuity chart. Your vision qualifies as “normal” 20/20 if you can read the same letters at 20 feet that a person with standard vision reads at that distance.
The smaller letters might give you trouble, but there’s good news. Modern medicine offers solutions – approximately 97% of short-sighted patients achieve 20/20 or better vision after laser eye surgery. British patients can access these treatments starting at £6,200 for both eyes, with interest-free payment plans available.
This piece takes you through the Snellen chart’s interpretation. You’ll learn what those fractions like 6/6 or 20/20 mean and understand the threshold for “legally blind” status (20/200 vision in the US). Let’s tuck into the details of this remarkable vision assessment tool.
What is the Snellen Eye Chart?
The Snellen eye chart remains one of the most recognisable medical tools in history. Dutch ophthalmologist Dr. Hermann Snellen created this groundbreaking chart in 1862. His invention transformed the way doctors diagnosed and treated vision problems.
Origin and purpose of the chart
Eye care lacked any standard approach before Dr. Snellen’s breakthrough. Ophthalmologists used whatever methods they preferred to assess vision. Some used different chart designs while others relied on pictures of flowers, waggons, or houses. Dr. Snellen’s colleague, Dr. Franciscus Donders, asked him to create the chart. Dr. Donders had been using wall charts to diagnose vision problems.
The chart’s main goal brought a revolutionary change – it gave doctors the first standardised way to measure visual acuity. Patients could now visit any eye care provider and get consistent results. This consistency proved especially valuable during the industrial revolution. Good eyesight became crucial for many jobs, from factory workers to railroad engineers.
Design and structure of the chart
A standard Snellen chart measures 22 inches wide by 11 inches tall. The chart features 11 rows of block letters. The top row shows a single large letter (usually E, H, or N). Each following row has more letters that get smaller as you read down.
The chart’s design follows exact geometric principles. Snellen created his optotypes (the letters on the chart) on a 5×5 grid with these rules:
- Each line’s thickness equals one unit
- Letters measure five units in width and height
- White spaces between lines match the line thickness
- Letters like ‘C’ have gaps equal to the line thickness
The sizing follows precise math too. Letters showing 20/40 vision are exactly twice as large as those showing 20/20 vision.
Why only certain letters are used
The chart uses just nine specific letters: C, D, E, F, L, O, P, T, and Z. These letters weren’t picked by chance. Snellen chose them because they appeared in Dutch language symbols and gave reliable test results.
Some letters prove easier to spot than others. To name just one example, see how L and T are usually easier to recognise than B and C. Using just these nine letters helps the test give more consistent results across different patients and testing situations. The Snellen chart’s careful design and thoughtful letter selection explain why it has remained the primary tool for testing visual acuity for over 160 years.
How to Use the Snellen Chart for Vision Testing
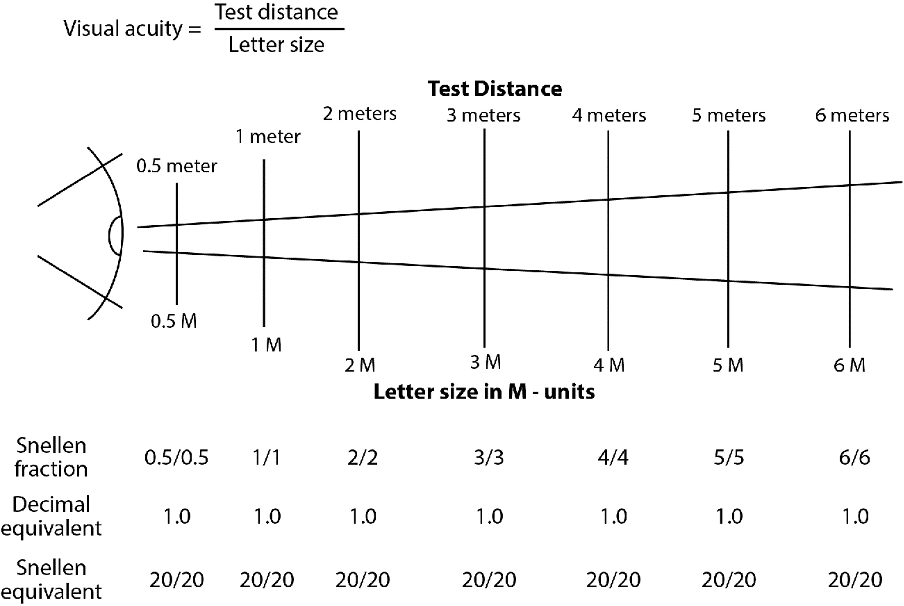
Image Source: Precision Vision
A proper vision test with the Snellen eye chart demands both precision and consistency. The right procedures will give accurate results that show if someone just needs vision correction.
Step-by-step testing procedure
The Snellen eye chart test needs specific conditions to produce reliable results. The person should stand 20 feet (6 metres) from the chart. Everything in proper lighting matters – the room and chart must be well-lit. Patients who wear corrective lenses should keep them on to check their corrected visual acuity.
The testing process goes like this:
- The patient stands at the marked spot on the floor
- They should wear their distance vision glasses if they use them
- Give them an occluder to block one eye
- Ask them to read the smallest line they can see clearly
- They should try the next line down if they read all letters right
- Write down that eye’s result and test the other eye
Testing one eye at a time
Each eye tested separately gives vital diagnostic information. Start with the weaker eye while the good eye stays covered. This helps prevent patients from memorising the chart with their stronger eye and affecting the weaker eye’s results.
The occluder should block all vision without pressing on the untested eye. Patients can also use their hand to cover the eye not being tested. A pinhole occluder test comes next if they don’t achieve 6/6 (normal vision) with their current glasses. Better vision through the pinhole shows the visual problems might be fixed with the right prescription.
Using mirrors in small spaces
Many testing facilities don’t have a full 20-foot testing lane. Mirrors are a great way to get proper Snellen tests done in smaller spaces. Clinicians can create the needed 20-foot distance by bouncing the chart image off a mirror.
The total path should measure 20 feet (6 metres) – from patient to mirror plus mirror to chart. To cite an instance, see a 10-foot room where patient and chart sit at opposite ends with the mirror between them. Mirrors work especially well in smaller exam rooms without losing accuracy. Testing at shorter distances creates unwanted focusing demands that might affect refraction results.
Understanding Snellen Chart Results

Snellen eye chart test results tell you a lot about your visual health. Your optometrist uses those mysterious fractions to document precise measurements of your visual acuity.
What 6/6 or 20/20 vision means
Many people believe “6/6” (or “20/20” in the US) means perfect vision. This is a misconception. The measurement represents standard vision – what average people see at specific distances. Dr. Snellen chose his reference standard as a size that “easily recognised by normal eyes”. Most people with healthy eyes match or exceed this baseline. Research shows only 35% of adults can read the 20/20 line without correction. Some people achieve better results than 6/6 vision, like 6/5 or 6/4 – RAF pilots must meet this standard.
How to read the Snellen fraction
Two important numbers make up the Snellen fraction:
- The numerator (first number) shows the testing distance (usually 6 metres in the UK)
- The denominator (second number) shows the distance at which standard vision could read the same line
Someone with 6/12 vision sees at 6 metres what a person with standard vision sees from 12 metres away.
Examples of common results like 6/12 or 6/60
Different Snellen results show various levels of visual acuity:
| Result | Meaning |
|---|---|
| 6/5 | Better than standard – can see at 6m what normal vision sees at 5m |
| 6/6 | Standard vision |
| 6/12 | Needs to be twice as close to see the same detail |
| 6/60 | The largest letter on most charts – considered “legally blind” in some countries |
Legal vision standards for driving
UK drivers must have visual acuity of at least 6/12 on the Snellen scale (with glasses or contact lenses if needed). They must also read a car number plate from 20 metres away. Your home vision test showed a low score? Precision Vision London offers advanced laser eye surgery options to help improve your visual clarity.
Police officers can ask drivers to take roadside eyesight tests. Failing these tests breaks the law and could void your motor insurance. Eye tests every two years help ensure your vision stays safe for driving.
Modern Uses and Limitations
The Snellen eye chart keeps evolving in modern optometry despite its historical importance, though it faces several built-in limitations.
Snellen eye chart UK standards
British optometrists use a different standard from other countries. They record visual acuity as 6/6 instead of the American 20/20 notation, which shows the standard 6-metre testing distance. UK drivers need a minimum visual acuity of 6/12 on the Snellen scale, and they can use corrective lenses. Royal Air Force pilots must show even better vision with an impressive 6/5 unaided acuity in each eye.
Limitations of the Snellen chart
The Snellen chart has several drawbacks despite being used worldwide:
- Inconsistent design: Lines have different numbers of characters with fewer letters on higher acuity lines. This makes statistical comparisons difficult
- Irregular progression: Line spacing isn’t standardised. A “two-line improvement” means different vision gains depending on your starting point
- Letter recognition issues: Letters like S, F, C, and B are harder to spot than A, L, T, and Z. This can affect test results
- Language barriers: Only patients who know the Roman alphabet and have no communication problems can take the test
- Environmental factors: Standard tests don’t match real-life conditions with changing contrast and lighting
Digital and electronic chart alternatives
Technology has reshaped vision testing completely. Digital options now include computer eye charts with adjustable contrast, backlit displays, and random letter presentation that prevents memorization. Apps like EyeChart and Peek Acuity let doctors check vision remotely. Studies show these might give slightly different results than traditional methods. These digital tools are a great way to get better access and efficiency, especially when you have rural or immobilised patients.
Other visual acuity chart types (LEA, Tumbling E, Jaeger)
Many other charts help solve Snellen’s shortcomings:
- Tumbling E: Snellen created this version showing the letter E facing different ways. It works great for children and non-English speakers
- Landolt C: Uses a broken ring pointing various ways. The International Council of Ophthalmology calls it a laboratory standard
- LEA Symbols: Made just for kids, using symbols they can recognise in a playful setting
- Jaeger Chart: Checks close-up vision using text paragraphs that get smaller
- LogMAR/ETDRS: Provides better spacing and letter progression, giving more accurate statistics than Snellen charts
Conclusion
Understanding Your Vision Health Through the Snellen Chart
The Snellen eye chart has shaped vision assessment for over 160 years. This simple arrangement of letters has helped countless people understand their visual acuity and guided everything from simple vision correction to life-changing surgeries.
Your Snellen test results give you the ability to make informed decisions about your eye health. The fractions—6/6 in British notation or 20/20 in American measurements—tell a precise story about how well you see compared to the standard. On top of that, it helps detect changes early through regular testing that can prevent serious problems with timely intervention.
The traditional Snellen chart has limitations, but modern adaptations and digital alternatives deal well with these challenges. Alternative charts like the LogMAR, Tumbling E, and LEA Symbols ensure accurate testing whatever your age, language barriers, or specific testing needs. So vision assessment keeps evolving while staying true to the basic principles Dr. Snellen created in 1862.
Your vision is one of your most valuable assets. Regular eye examinations are vital, whatever vision problems you might or might not have right now. The next time you stand before that familiar chart with one eye covered, you’ll appreciate the science and history behind these carefully designed letters that protect your precious sight.
FAQs
Q1. How is a Snellen eye test typically conducted? The test is performed by standing 6 metres (20 feet) away from the chart. Each eye is tested separately, starting with the weaker eye. You’ll be asked to read the smallest line of letters you can see clearly. The smallest line you can read accurately represents your visual acuity.
Q2. What alternatives are available if someone can’t read the Snellen chart? For those who can’t read the traditional Snellen chart, there are several alternatives. These include charts with numbers or shapes instead of letters, matching tests like HOTV for young children, and non-verbal techniques such as retinoscopy and autorefraction.
Q3. What does 20/20 or 6/6 vision mean on a Snellen chart? 20/20 (or 6/6 in the UK) vision represents standard vision, not perfect vision. It means you can see at 20 feet (or 6 metres) what a person with normal vision can see at that distance. Some people can achieve better than 20/20 vision, such as 20/15 or 20/10.
Q4. Are there digital versions of the Snellen chart available? Yes, there are digital and electronic alternatives to the traditional Snellen chart. These include computerised eye charts with adjustable contrast, backlit displays, and even smartphone apps. While convenient, studies show these digital versions may slightly under or overestimate vision compared to traditional methods.
Q5. What are the vision requirements for driving in the UK? In the UK, drivers must have a visual acuity of at least 6/12 on the Snellen scale (with corrective lenses if necessary). Additionally, you must be able to read a car number plate from 20 metres away. Regular eye tests are recommended to ensure you maintain safe driving vision.